Calculates and plots common diversity and overlap measures for repertoires and alike. Requires the vegan package
Source:R/VDJ_diversity.R
VDJ_diversity.RdCalculates and plots common diversity and overlap measures for repertoires and alike. Requires the vegan package
VDJ_diversity(
  VDJ,
  feature.columns,
  grouping.column,
  metric,
  VDJ.VJ.1chain,
  subsample.to.same.n
)
Arguments
- VDJ
VDJ dataframe output from the VDJ_GEX_matrix function.
- feature.columns
Character vector. One or more column names from the VDJ of which diversity or overlap metrics are calculated. if more than one column is provided (e.g. c("VDJ_cdr3s_aa","VJ_cdr3s_aa")) these columns will be pasted together before metric calculation.
- grouping.column
Character. Column name of a column to group metrics by. This could be "sample_id" to calculate the metric for each sample. This column is required if metric = "simpson". If so, the simpson overlap index will be calculated pairwise for all combinations of elements in the grouping.column. Defaults to "none".
- metric
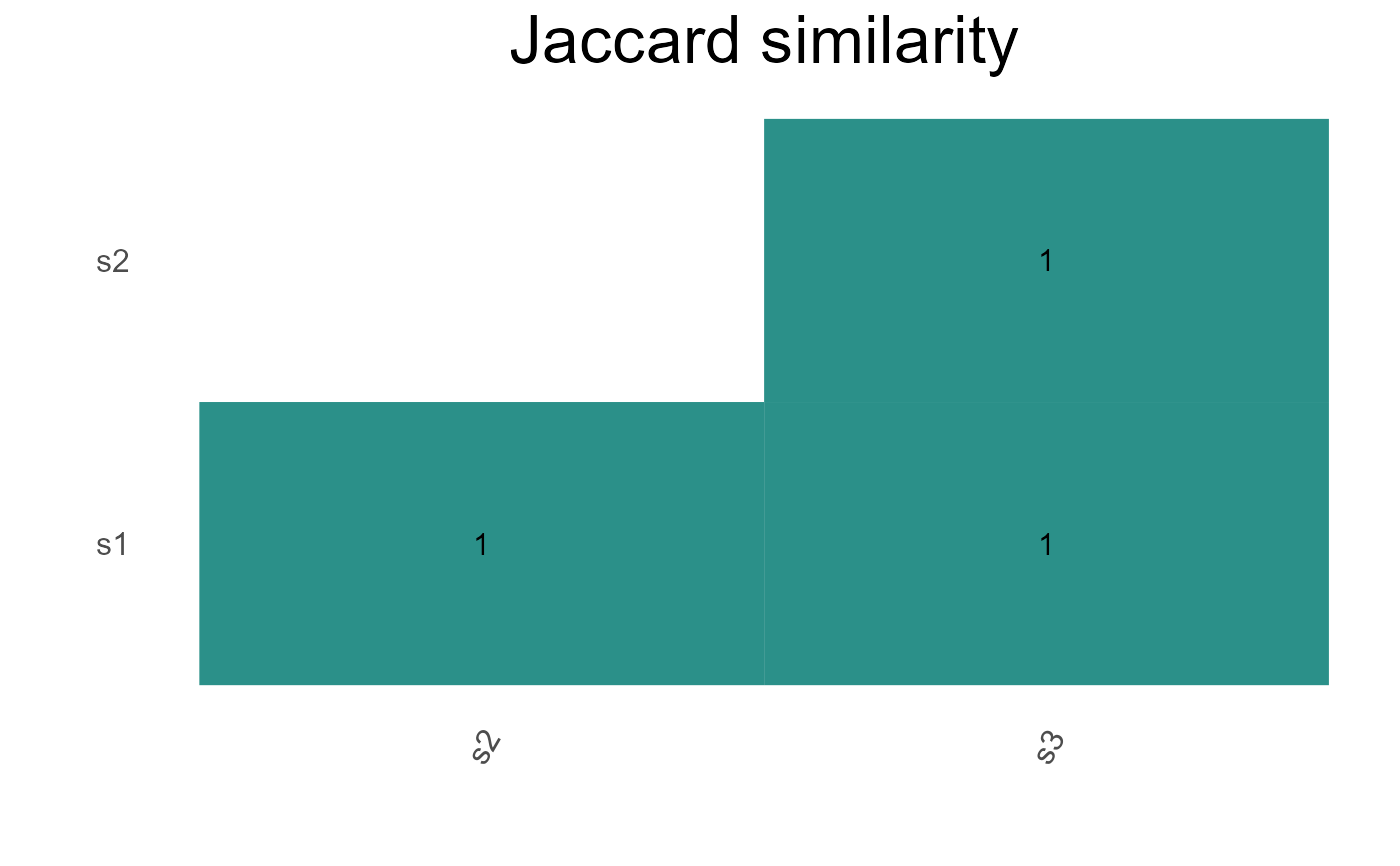
Character. Diversity or overlap metric to calculate. Can be c("richness", "bergerparker", "simpson", "ginisimpson", "shannon", "shannonevenness", "jaccard"). Defaults to "shannon". If jaccard is selected, a heatmap with the pairwise comparisons between all groups is returned. If any of the others is selected, a dotplot is returned
- VDJ.VJ.1chain
Boolean defaults to TRUE. Whether to filter out aberrant cells (more than 1 VDJ or VJ chain).
- subsample.to.same.n
Boolean defaults to TRUE. Whether to subsample larger groups down to the size of the smallest group
Value
Returns a ggplot with the calculated metric for each group (if provided).
Examples
#Calculate shannon index for VDJ CDR3s by sample
plot <- VDJ_diversity(VDJ = Platypus::small_vgm[[1]],
,feature.columns = c("VDJ_cdr3s_aa"), grouping.column = "sample_id"
,metric = "shannon")

#Calculate Gini-simpson and Simpson index for VDJ and VJ CDR3s by sample
VDJ_diversity(VDJ = Platypus::small_vgm[[1]],
,feature.columns = c("VDJ_cdr3s_aa","VJ_cdr3s_aa"), grouping.column = "sample_id"
,metric = "ginisimpson")


#Calculate Jaccard index of J gene usage between two samples
VDJ_diversity(VDJ = Platypus::small_vgm[[1]],
,feature.columns = c("VDJ_jgene"), grouping.column = "sample_id"
,metric = "jaccard")
#Calculate Jaccard index of J gene usage between two samples
VDJ_diversity(VDJ = Platypus::small_vgm[[1]],
,feature.columns = c("VDJ_jgene"), grouping.column = "sample_id"
,metric = "jaccard")