Scatter plot for coexpression of two selected genes
Source:R/GEX_scatter_coexpression.R
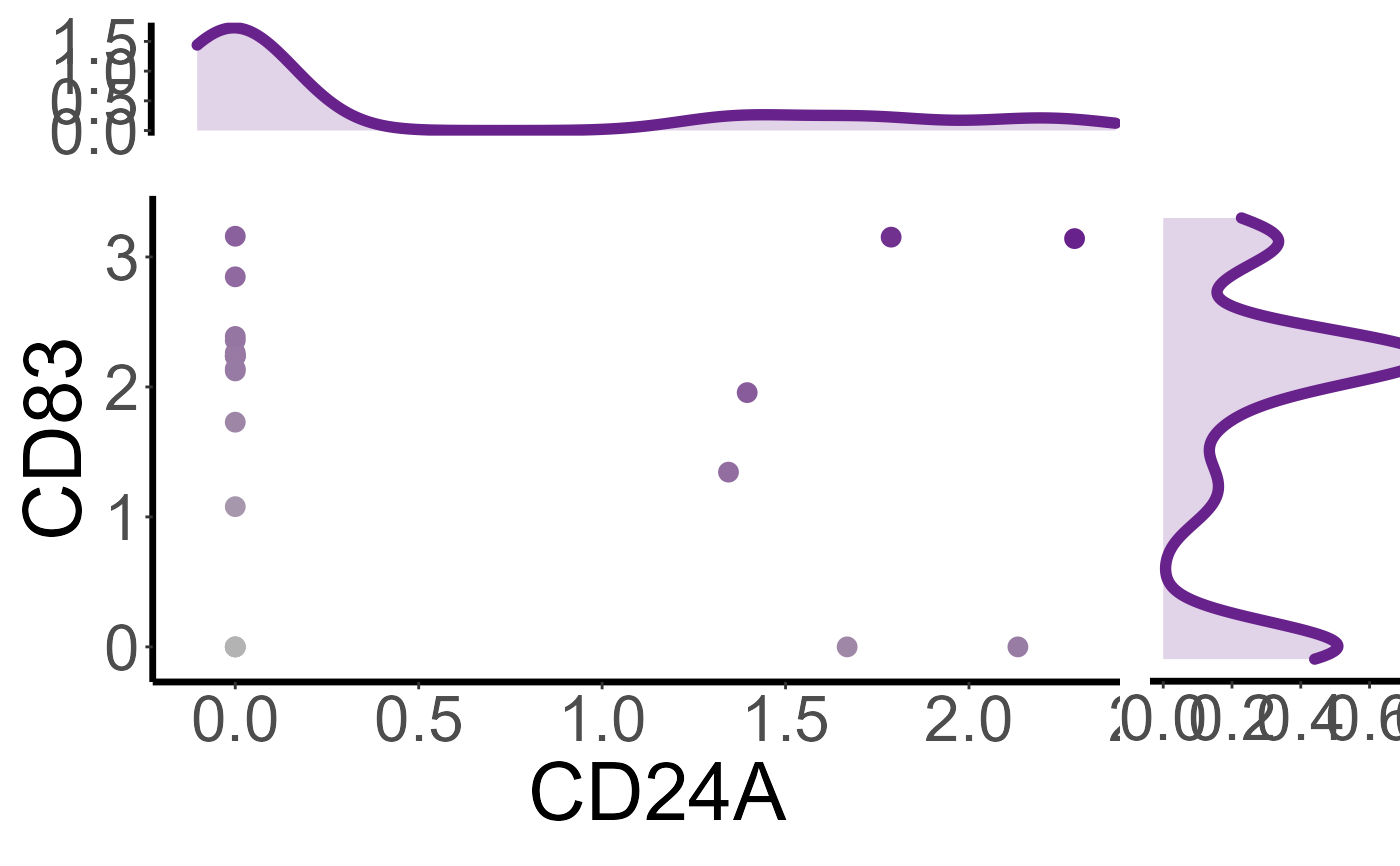
GEX_scatter_coexpression.RdPlots a composite figure showing single marker expression as histograms and coexpression as a scatterplot.
GEX_scatter_coexpression(GEX, gene.1, gene.2, color.theme)Arguments
- GEX
GEX seurat object generated with VDJ_GEX_matrix
- gene.1
Character. Name of a gene in rownames(VDJ.matrix)
- gene.2
Character. Name of a gene in rownames(VDJ.matrix)
- color.theme
Character. A color to use for the composite plot
Value
Returns a gridplot showing coexpression scatterplot as well as histograms of gene.1 and gene.2
Examples
gene1 <- "CD24A"
gene2 <- "CD83"
GEX_scatter_coexpression(GEX = Platypus::small_vgm[[2]], gene1,gene2)