Plots proportions of a group of cells within a secondary group of cells. E.g. The proportions of samples in seurat clusters, or the proportions of samples in defined cell subtypes
Source:R/GEX_proportions_barplot.R
GEX_proportions_barplot.RdPlots proportions of a group of cells within a secondary group of cells. E.g. The proportions of samples in seurat clusters, or the proportions of samples in defined cell subtypes
GEX_proportions_barplot(GEX, source.group, target.group, stacked.plot, verbose)Arguments
- GEX
GEX Seurat object generated with VDJ_GEX_matrix (VDJ_GEX_matrix.output[[2]])
- source.group
Character. A column name of the GEX@meta.data with the group of which proportions should be plotted
- target.group
Character. A column name of the GEX@meta.data with the group to calculate proportions within. If unsure, see examples for clarification
- stacked.plot
Boolean. Defaults to FALSE. Whether to return a stacked barplot, with the y axis representing the % of cells of the target group. If set to FALSE a normal barplot (position = "dodge") will be returned with the y axis representing the % of cells of the source group
- verbose
Print information about factor levels and ordering to console
Value
Returns a ggplot barplot showing cell proportions by source and target group.
Examples
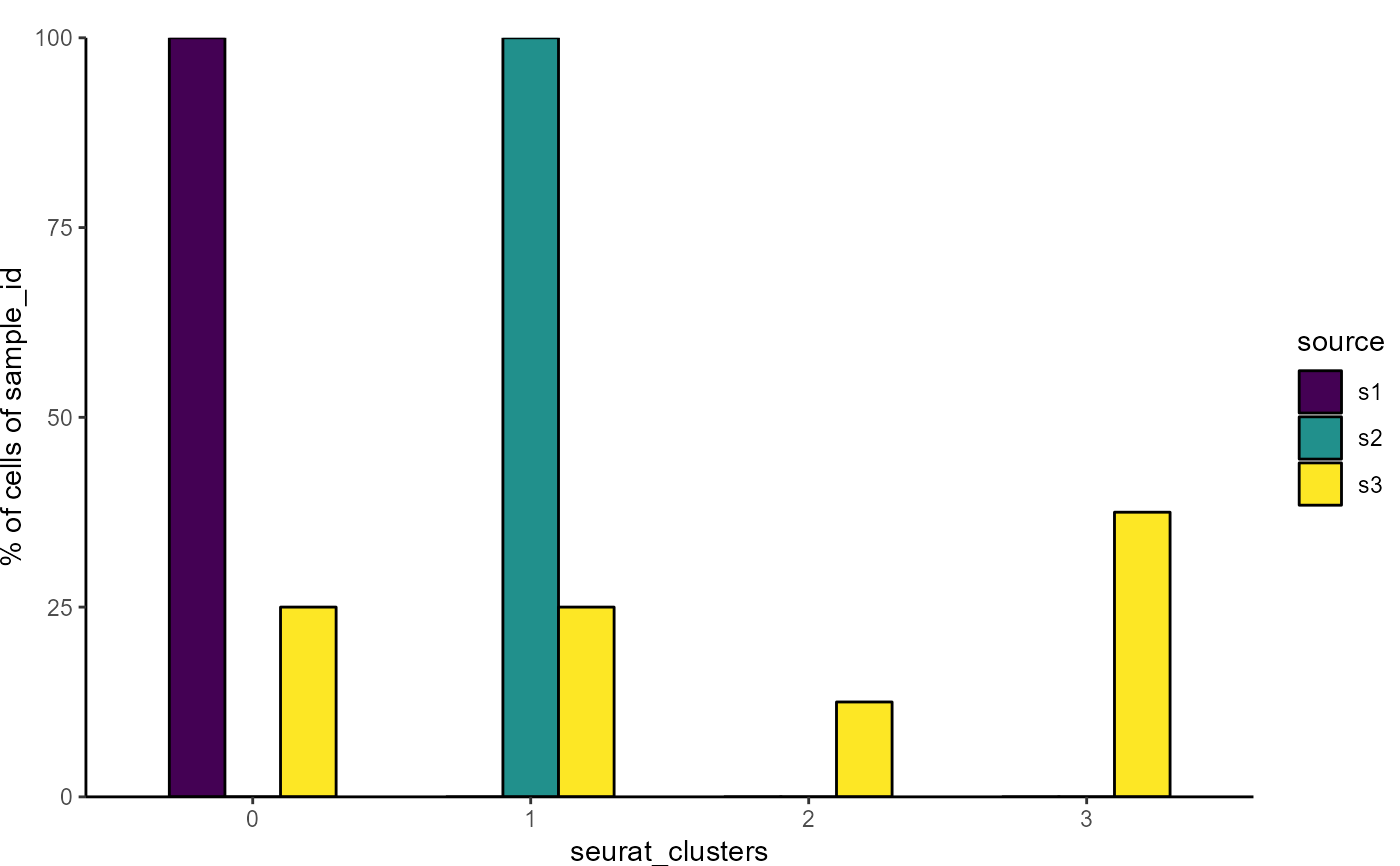
#To return a normal barplot which shows the % of cells of
#each sample contained in each cluster
GEX_proportions_barplot(GEX = Platypus::small_vgm[[2]], source.group = "sample_id"
, target.group = "seurat_clusters",stacked.plot = FALSE)
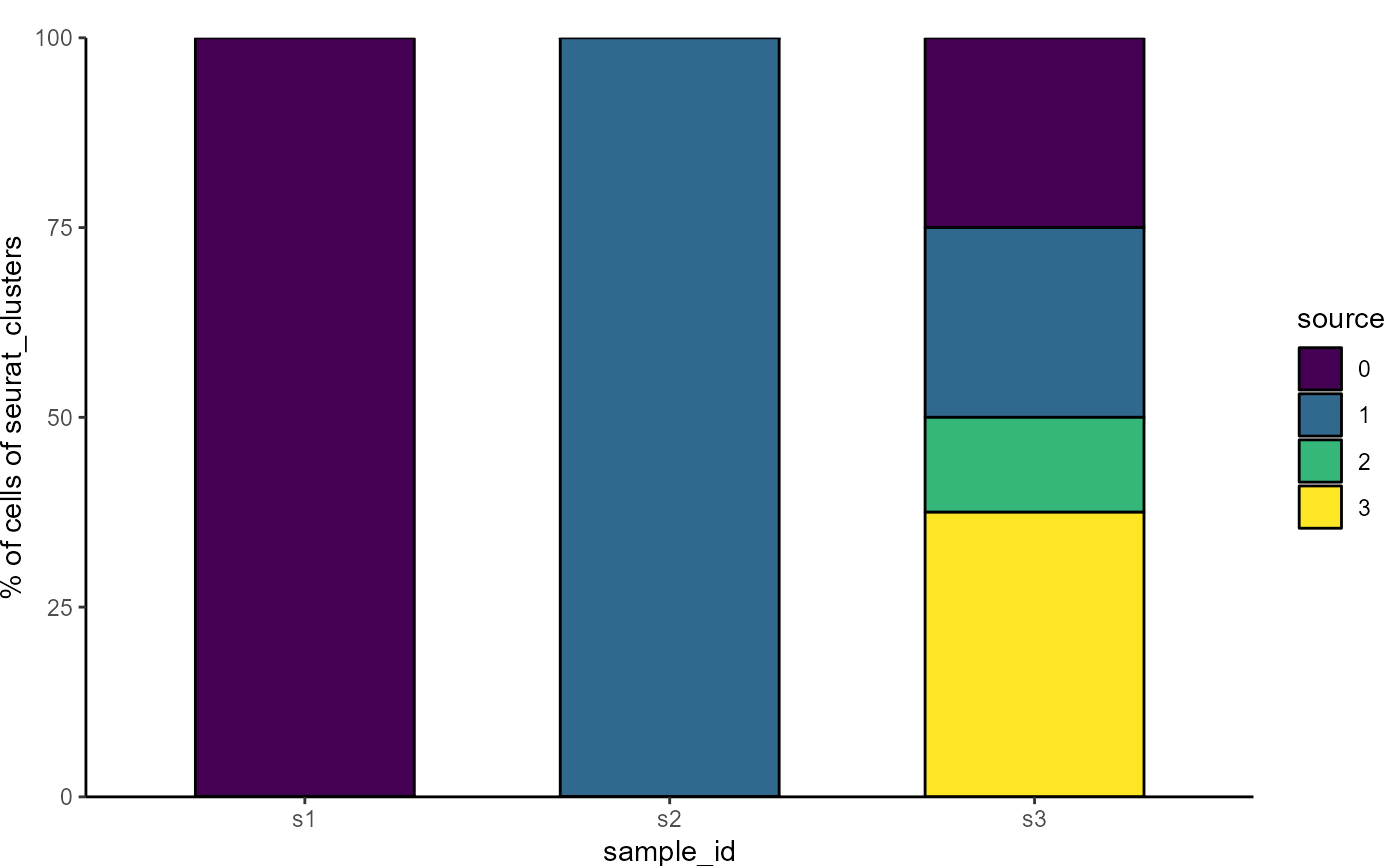
 #To return a stacked barplot which shows the % of cells of each
#cluster attributed to each sample
GEX_proportions_barplot(GEX = Platypus::small_vgm[[2]],
source.group = "seurat_clusters", target.group = "sample_id"
,stacked.plot = TRUE)
#> [1] 0 1 2 3
#> Levels: 0 < 1 < 2 < 3 < 4 < 5 < 6
#To return a stacked barplot which shows the % of cells of each
#cluster attributed to each sample
GEX_proportions_barplot(GEX = Platypus::small_vgm[[2]],
source.group = "seurat_clusters", target.group = "sample_id"
,stacked.plot = TRUE)
#> [1] 0 1 2 3
#> Levels: 0 < 1 < 2 < 3 < 4 < 5 < 6