Plotting of GEX phenotype by VDJ clone
Source:R/GEX_phenotype_per_clone.R
GEX_phenotype_per_clone.RdIntegrates VDJ and gene expression libraries by providing cluster membership seq_per_vdj object and the index of the cell in the Seurat RNA-seq object. ! For platypus.version == "v3" and VDJ_GEX_matrix output the function will iterate over entries in the sample_id column of the GEX by default.
GEX_phenotype_per_clone(
  GEX,
  clonotype.ids,
  global.clonotypes,
  GEX.group.by,
  GEX.clonotypes,
  platypus.version
)
Arguments
- GEX
For platypus.version == "v3" the GEX object from the output of the VDJ_GEX_matrix function (VDJ_GEX_matrix.output \[\[2\]\]). For platypus.version == "v2" a single seurat object from automate_GEX function after labeling cell phenotypes using the GEX_phenotype function.
- clonotype.ids
For platypus.version == "v2" Output from either VDJ_analyze or VDJ_clonotype functions. This list should correspond to a single GEX.list object, in which each list element in clonotype.list is found in the GEX.object. Furthermore, these repertoires should be found in the automate_GEX library.
- global.clonotypes
Boolean. Defaults to FALSE. Set to True if clonotyping has been done across samples
- GEX.group.by
For platypus.version == "v3". Character. Column name of the GEX@meta.data to group barplot by. Defaults to seurat_clusters
- GEX.clonotypes
For platypus.version == "v3". Numeric vector with ids of clonotypes to plot e.g. c(1,2,3,4). Can also be set to "topclones"
- platypus.version
Set to either "v2" or "v3" depending on wether suppyling GEX_automate or VDJ_GEX_matrix\[\[2\]\] objects. Defaults to "v3"
Value
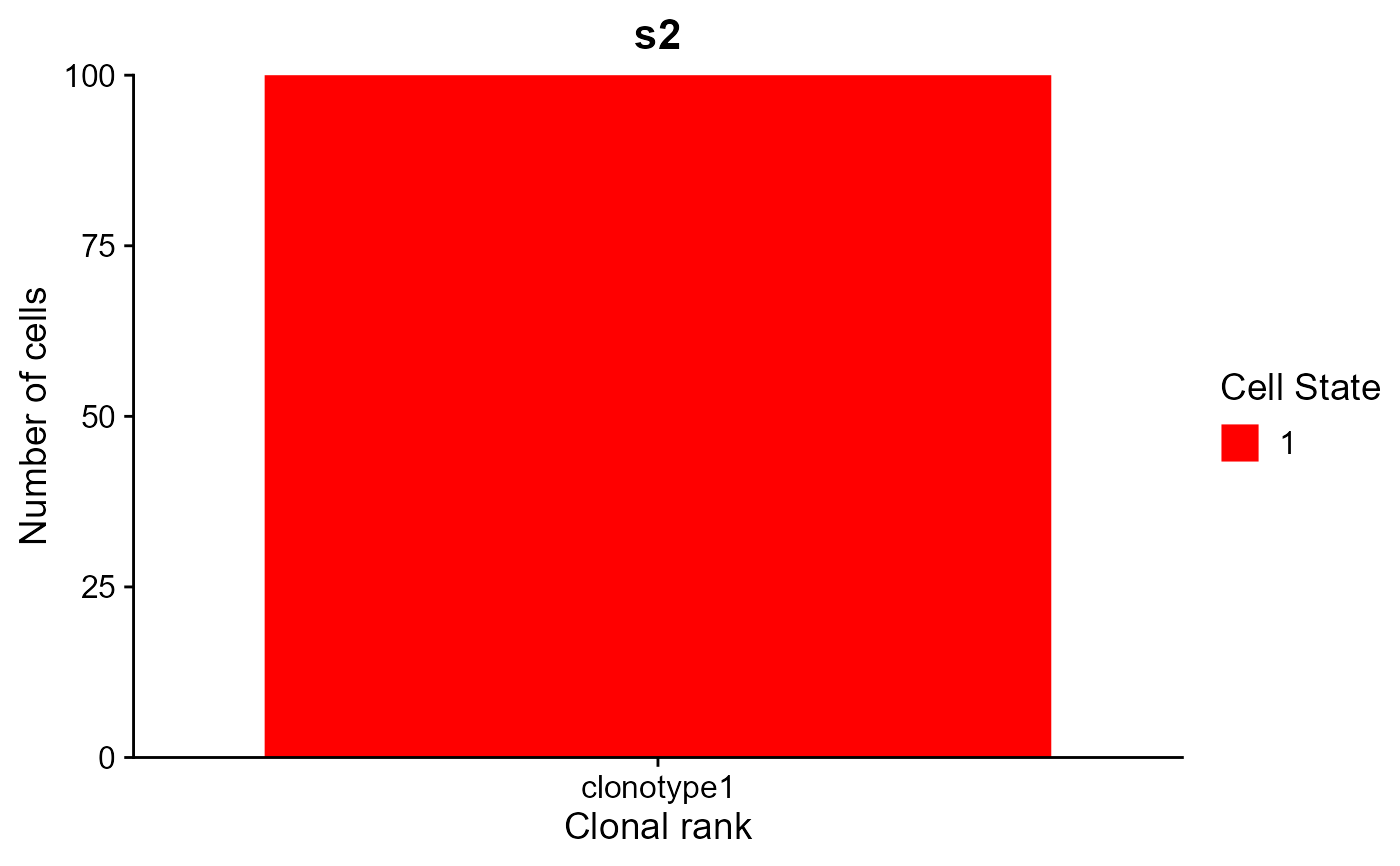
Returns a stacked barplot that visualizes the seurat cluster membership for different cell phenotypes.
Examples
#For testing: only a single clonotype in two samples
small_vgm_cl <- Platypus::small_vgm
small_vgm_cl[[2]]$clonotype_id_10x <- "clonotype1"
GEX_phenotype_per_clone(GEX = small_vgm_cl[[2]]
, GEX.clonotypes = c(1), GEX.group.by = "seurat_clusters", platypus.version = "v3")
#> [[1]]
 #>
#> [[2]]
#>
#> [[2]]
 #>
#> [[3]]
#>
#> [[3]]
 #>
#>