Wrapper for calculating pairwise differentially expressed genes
Source:R/GEX_pairwise_degs.R
GEX_pairwise_DEGs.RdProduces and saves a list of volcano plots with each showing differentially expressed genes between pairs groups. If e.g. seurat_clusters used as group.by, a plot will be generated for every pairwise comparison of clusters. For large numbers of this may take longer to run. Only available for platypus v3
GEX_pairwise_DEGs(
  GEX,
  group.by,
  min.pct,
  RP.MT.filter,
  label.n.top.genes,
  genes.to.label,
  save.plot
)
Arguments
- GEX
Output Seurat object of the VDJ_GEX_matrix function (VDJ_GEX_matrix.output[[2]])
- group.by
Character. Defaults to "seurat_clusters" Column name of GEX@meta.data to use for pairwise comparisons. More than 20 groups are discuraged.
- min.pct
Numeric. Defaults to 0.25 passed to Seurat::FindMarkers
- RP.MT.filter
Boolean. Defaults to True. If True, mitochondrial and ribosomal genes are filtered out from the output of Seurat::FindMarkers
- label.n.top.genes
Integer. Defaults to 50. Defines how many genes are labelled via geom_text_repel. Genes are ordered by adjusted p value and the first label.n.genes are labelled
- genes.to.label
Character vector. Defaults to "none". Vector of gene names to plot indipendently of their p value. Can be used in combination with label.n.genes.
- save.plot
Boolean. Defaults to True. Whether to save plots as appropriately named .png files
Value
A nested list with out[[i]][[1]] being ggplot volcano plots and out[[i]][[2]] being source DEG dataframes.
Examples
GEX_pairwise_DEGs(GEX = Platypus::small_vgm[[2]],group.by = "sample_id"
,min.pct = 0.25,RP.MT.filter = TRUE,label.n.top.genes = 2,genes.to.label = c("CD24A")
,save.plot = FALSE)
#> Calculating pairwise DEGs 1 of 3
#> [1] s1
#> Levels: s3 < s2 < s1
#> [1] s2
#> Levels: s1 < s2 < s3
#>
| | 0 % ~calculating
|+++++++++++++++++ | 33% ~00s
|++++++++++++++++++++++++++++++++++ | 67% ~00s
|++++++++++++++++++++++++++++++++++++++++++++++++++| 100% elapsed=00s
#> Calculating pairwise DEGs 2 of 3
#> [1] s1
#> Levels: s3 < s2 < s1
#> [1] s3
#> Levels: s1 < s2 < s3
#>
| | 0 % ~calculating
|+++++++++++++++++++++++++ | 50% ~00s
|++++++++++++++++++++++++++++++++++++++++++++++++++| 100% elapsed=00s
#> Calculating pairwise DEGs 3 of 3
#> [1] s2
#> Levels: s3 < s2 < s1
#> [1] s3
#> Levels: s1 < s2 < s3
#>
| | 0 % ~calculating
|+++++++++++++++++ | 33% ~00s
|++++++++++++++++++++++++++++++++++ | 67% ~00s
|++++++++++++++++++++++++++++++++++++++++++++++++++| 100% elapsed=00s
#> [[1]]
#> [[1]][[1]]
 #>
#> [[1]][[2]]
#>
#> [[1]][[2]]
 #>
#> [[1]][[3]]
#>
#> [[1]][[3]]
 #>
#>
#> [[2]]
#> [[2]][[1]]
#> p_val avg_log2FC pct.1 pct.2 p_val_adj gene
#> CD83 0.1723594 -1.0511537 0.714 0.833 0.5170782 CD83
#> CD24A 0.3930155 -0.8896529 0.429 0.500 1.0000000 CD24A
#> CD19 0.6151259 -0.3196211 0.714 0.833 1.0000000 CD19
#>
#> [[2]][[2]]
#> p_val avg_log2FC pct.1 pct.2 p_val_adj gene
#> CD24A 0.0570895 1.2947904 0.429 0.000 0.1712685 CD24A
#> CD19 0.4436571 -0.5756002 0.714 0.625 1.0000000 CD19
#>
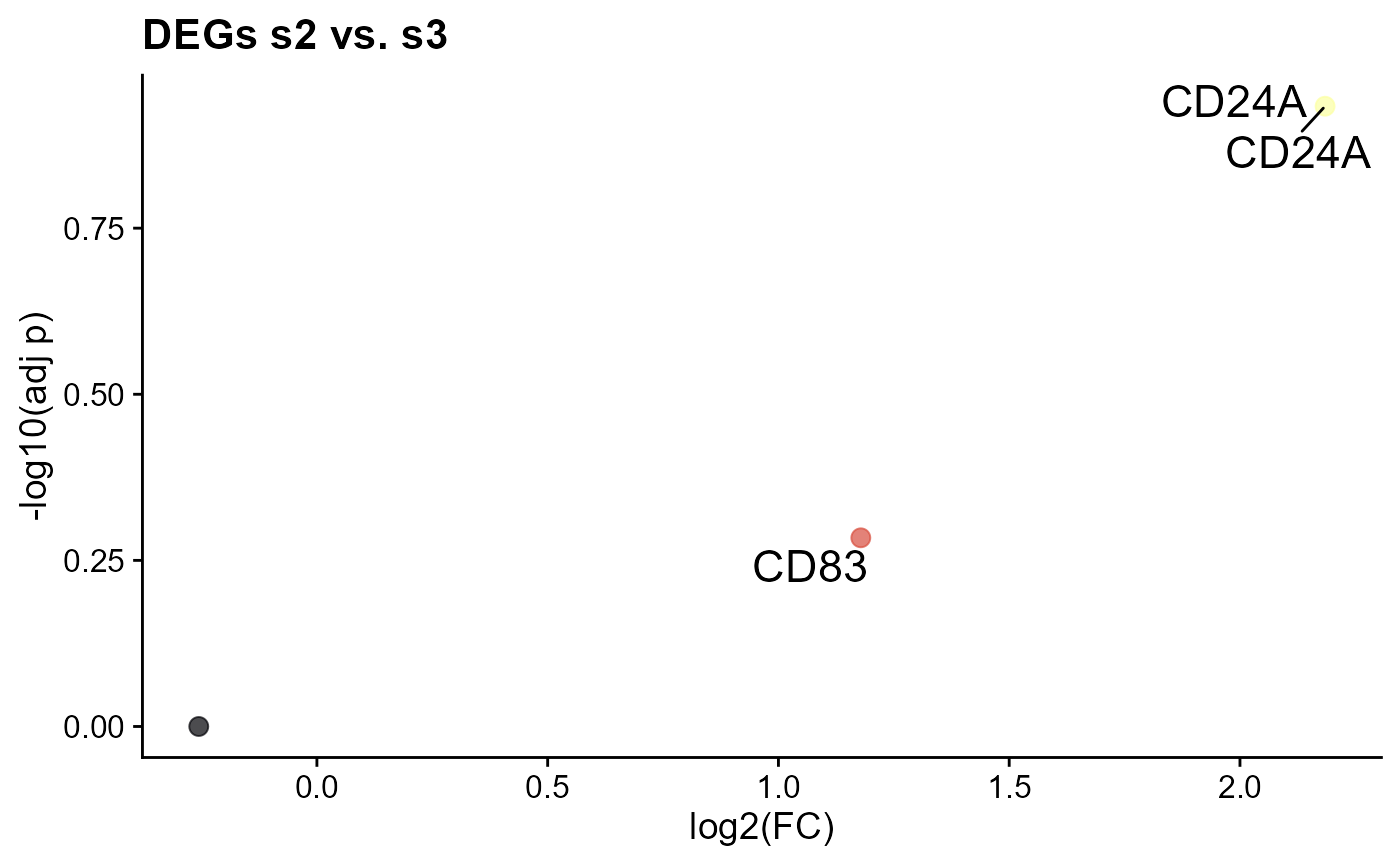
#> [[2]][[3]]
#> p_val avg_log2FC pct.1 pct.2 p_val_adj gene
#> CD24A 0.0388448 2.1844434 0.500 0.000 0.1165344 CD24A
#> CD83 0.1733424 1.1785108 0.833 0.750 0.5200272 CD83
#> CD19 0.6015535 -0.2559791 0.833 0.625 1.0000000 CD19
#>
#>
#>
#>
#> [[2]]
#> [[2]][[1]]
#> p_val avg_log2FC pct.1 pct.2 p_val_adj gene
#> CD83 0.1723594 -1.0511537 0.714 0.833 0.5170782 CD83
#> CD24A 0.3930155 -0.8896529 0.429 0.500 1.0000000 CD24A
#> CD19 0.6151259 -0.3196211 0.714 0.833 1.0000000 CD19
#>
#> [[2]][[2]]
#> p_val avg_log2FC pct.1 pct.2 p_val_adj gene
#> CD24A 0.0570895 1.2947904 0.429 0.000 0.1712685 CD24A
#> CD19 0.4436571 -0.5756002 0.714 0.625 1.0000000 CD19
#>
#> [[2]][[3]]
#> p_val avg_log2FC pct.1 pct.2 p_val_adj gene
#> CD24A 0.0388448 2.1844434 0.500 0.000 0.1165344 CD24A
#> CD83 0.1733424 1.1785108 0.833 0.750 0.5200272 CD83
#> CD19 0.6015535 -0.2559791 0.833 0.625 1.0000000 CD19
#>
#>