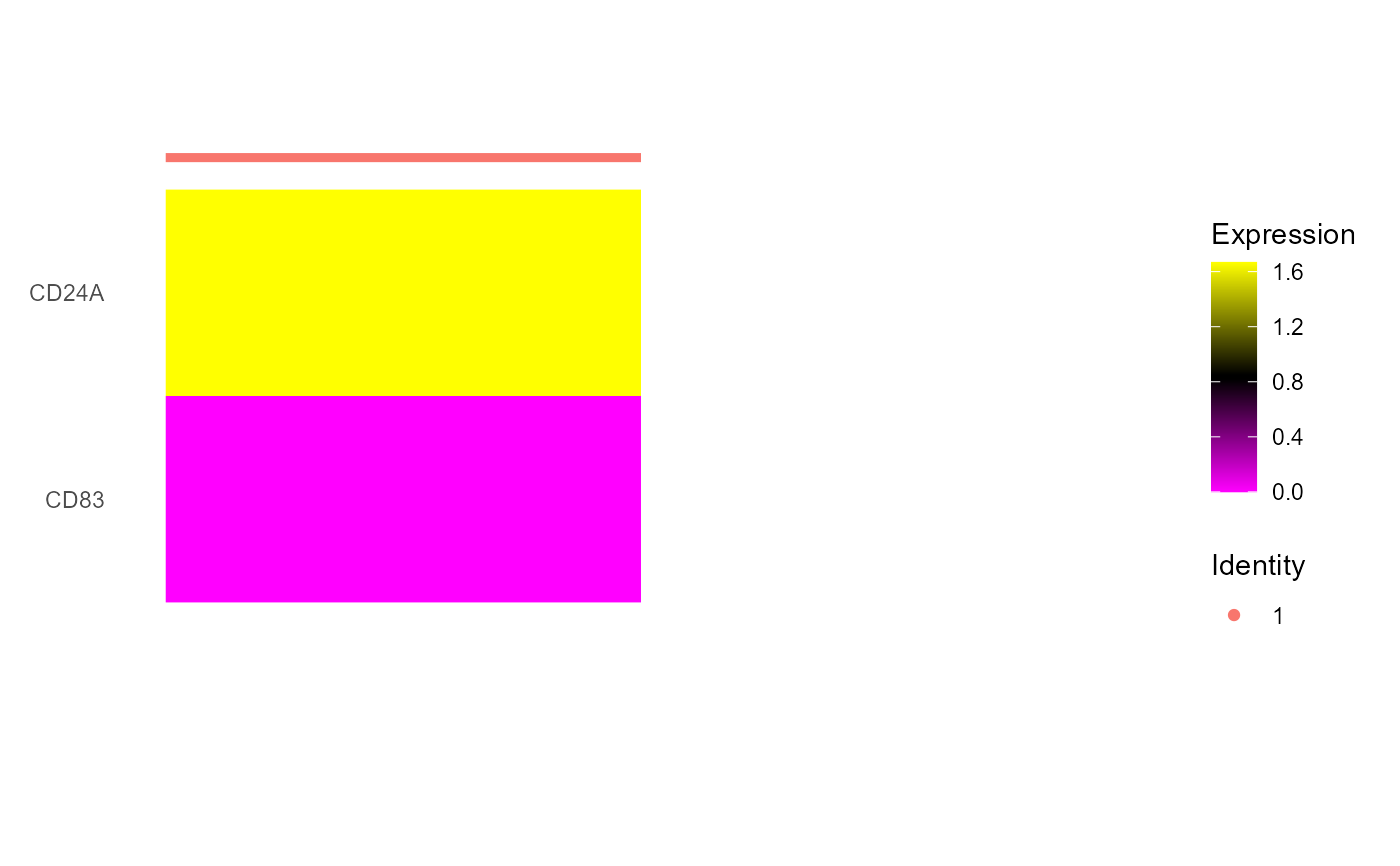
Produces a heatmap containing gene expression information at the clonotype level. The rows correspond to different genes that can either be determined by pre-made sets of B or T cell markers, or can be customized by the user. The columns correspond to individual cells and the colors correspond to the different clonotype families.
GEX_heatmap(
  GEX,
  b.or.t,
  sample.index,
  clone.rank.threshold,
  custom.array,
  slot
)
Arguments
- GEX
A single seurat object from clonotype_GEX function corresponding to all of the samples in a single VDJ_analyze object. This will likely be supplied as clonotype_GEX.output[[i]] if there were multiple, distinct transcriptomes.
- b.or.t
Logical indicating if B or T cell gene panel should be used.
- sample.index
Corresponds to which repertoire should be used in the case that the length of clonotype.list has a length greater than 1. The transcriptional profiles from only one repertoire can be plotted at a time.
- clone.rank.threshold
A numeric that specifies the threshold clonal rank that specifies which clonotypes to extract transcriptome information from. For example, if 10 is supplied then the gene expression for the top ten clones included on the heatmap, separated by clonotype.
- custom.array
Corresponds to which repertoire should be used in the case that the length of clonotype.list has a length greater than 1. The transcriptional profiles from only one repertoire can be plotted at a time.
- slot
Seurat data slot from which to plot values. Can be "raw.data", "data" or "scale.data"
Value
Returns a heatmap via Seurat::DoHeatmap of gene expression per clonotype
See also
VDJ_extract_sequences