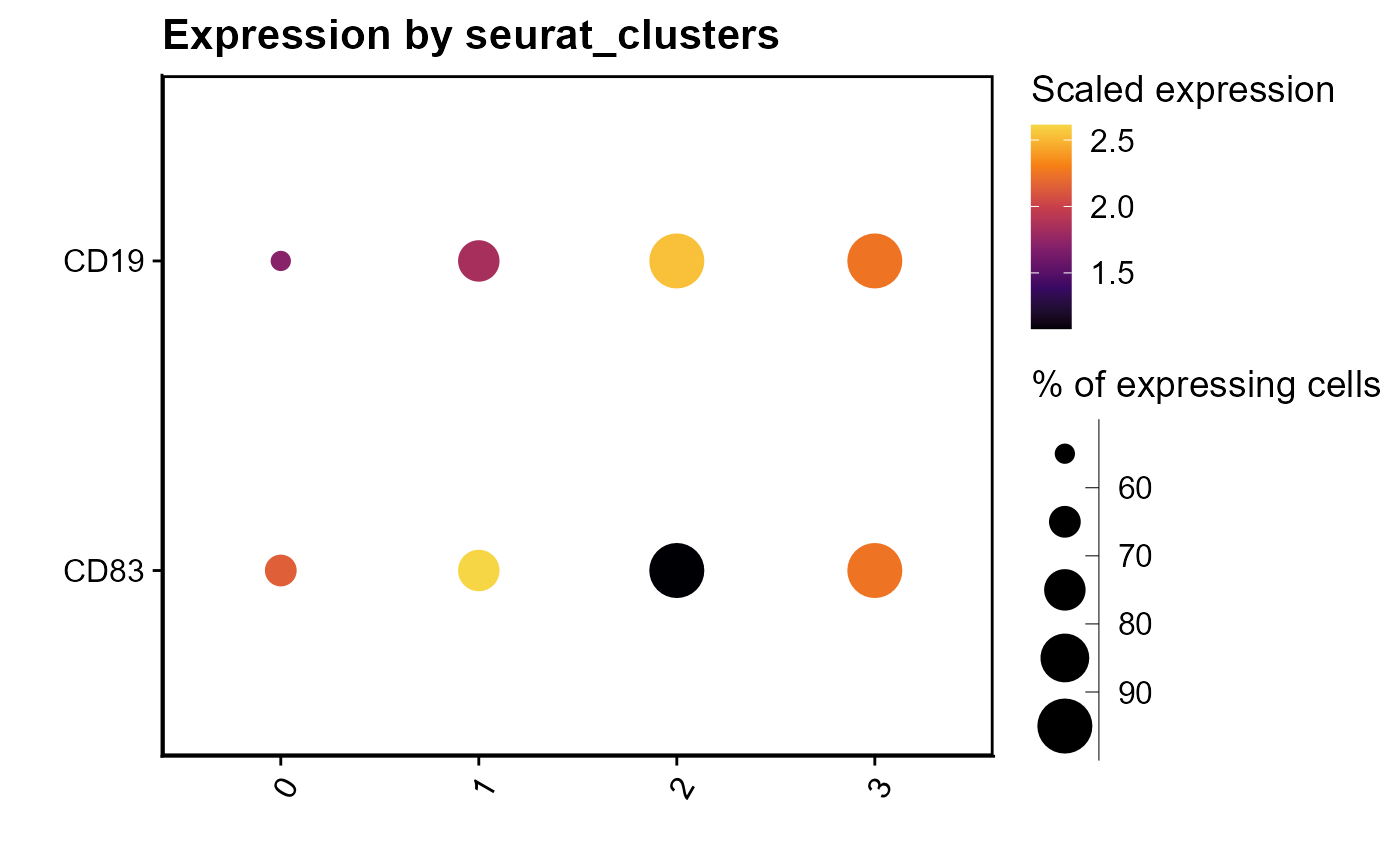
Outputs a dotplot for gene expression, where the color of each dot is scaled by the gene expression level and the size is scaled by the % of cells positive for the gene
GEX_dottile_plot(GEX, genes, group.by, threshold.to.plot, platypus.version)Arguments
- GEX
GEX seurat object generated with VDJ_GEX_matrix
- genes
Character vector. Genes of those in rownames(GEX) to plot. Can be any number, but more then 30 is discuraged because of cluttering
- group.by
Character. Name of a column in GEX@meta.data to split the plot by. If set to \"none\", a plot with a single column will be produced.
- threshold.to.plot
Integer 1-100. % of cells which must be expressing the feature to plot a point. If below, the field will be left empty
- platypus.version
This is coded for \"v3\" only, but in practice any Seurat Object can be fed in
Value
Returns a ggplot object were the dot size indicates the percentage of expressing cells and the dot color indicates the expression level.