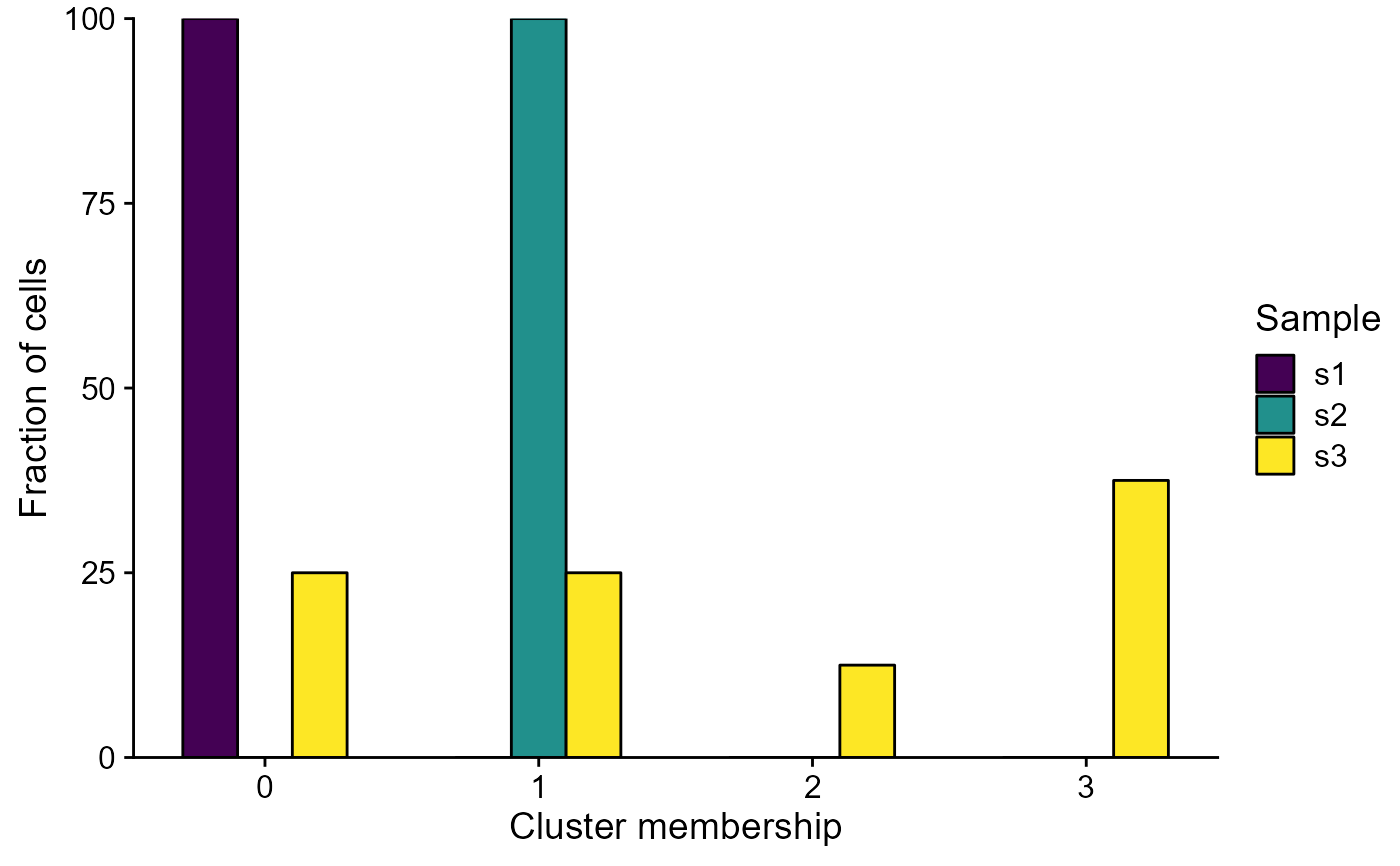
Plots the cluster membership for each of the distinct samples in the Seurat object from the automate_GEX function. The distinct samples are determined by "sample_id" field in the Seurat object.
GEX_cluster_membership(GEX, by.group, platypus.version)Arguments
- GEX
Output Seurat object containing gene expression data from automate_GEX (platypus.version = "v2") or VDJ_GEX_matrix (platypus.version = "v3", usually VDJ_GEX_matrix.output[[2]])function that contained at least two distinct biological samples. The different biological samples correspond to integer values (v2) or factor values (v3) in the order of the working directories initially supplied to the automate_GEX function.
- by.group
Logical indicating whether to look at the cluster distribution per group (using the group_id column). Default is set to FALSE.
- platypus.version
Version of platypus to use. Defaults to "v2". If an output of the GEX_automate function is supplied, set to "v2". If an output of the VDJ_GEX_matrix function is supplied set to "v3"
Value
Returns a ggplot object in which the values on the x axis correspond to each cluster found in the Seurat object. The y axis corresponds to the percentage of cells found in each cluster. The bar and color corresponds to the distinct sample_id.
Examples
#Platypus v2
#GEX_cluster_membership(GEX=automate_GEX_out[[2]], platypus.version = "v2")
#Platypus v3
GEX_cluster_membership(GEX= Platypus::small_vgm[[2]], platypus.version = "v3")